- Enriched, multi-parametric exam reviews
-
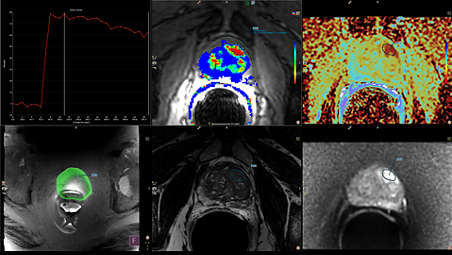
Enriched, multi-parametric exam reviews
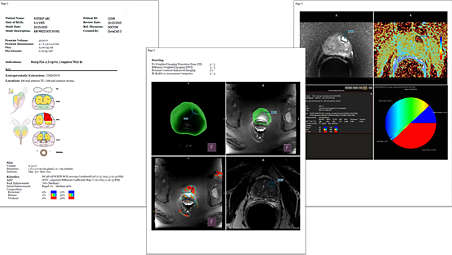
With a powerful, easy-to-navigate, multi-vendor MR image analysis system, DynaCAD can quickly process and manage large volumes of data. You can open cases in ready-to-read, custom hanging protocols with all images synchronized for easy, multi-parametric review. - Adjustable 3D segmentations for optimally guided biopsies
-
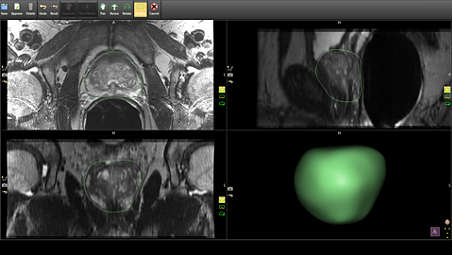
Adjustable 3D segmentations for optimally guided biopsies
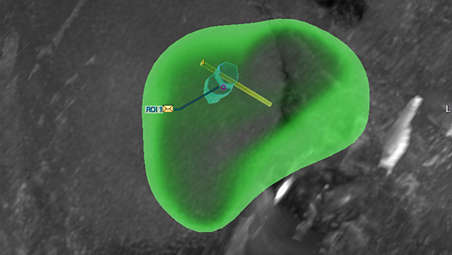
You can reduce manual outlining of the prostate gland: DynaCAD Prostate’s model-based gland segmentation automatically performs a 3D segmentation of the gland. You can alter or adjust the segmented results in all three planes. The resulting segmentation reports overall gland volume and sets the stage for UroNav MR/US guided fusion biopsy procedures. - Enhanced targeting of ROIs
-
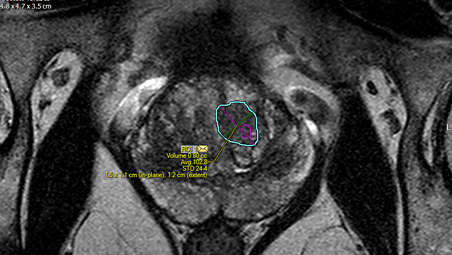
Enhanced targeting of ROIs
User generated ROIs can be displayed on a 3D model of the prostate as well as multiple image sequences from the study. - Interactive worksheets summarize study findings
-
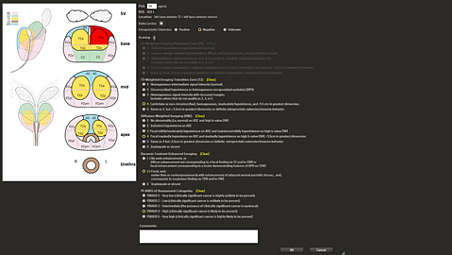
Interactive worksheets summarize study findings
PI-RADS® v2.1 interactive worksheets collate and classify data related to exam findings. Users can mark the finding locations within regional diagrams and utilize the PI-RADS® v2.1 lexicon to record their characteristics and grade severity – with automatic projection of the ROIs into the PI-RADS® sector map(s). - Exceptionally data-rich patient reports
-
Exceptionally data-rich patient reports
You can set up patient reports to automatically capture pre-selected image sequences, kinetic curves, measurements, and annotations. Lesions are assessed according to PI-RADS® v.2.1 scoring and are automatically registered to the PI-RADS sector map as 2D projections. This data is incorporated into standardized reports. Upon completion, you can print patient reports, save as a PDF, or send as DICOM images. - Overlays of previous biopsy targets provide valuable feedback
-
Overlays of previous biopsy targets provide valuable feedback
DynaCAD’s reverse fusion feature maps and displays earlier fusion guided biopsy locations. Users can view previous targets and cores produced by UroNav, allowing them to track accuracy.
Enriched, multi-parametric exam reviews
Enriched, multi-parametric exam reviews
Enriched, multi-parametric exam reviews
Adjustable 3D segmentations for optimally guided biopsies
Adjustable 3D segmentations for optimally guided biopsies
Adjustable 3D segmentations for optimally guided biopsies
Enhanced targeting of ROIs
Enhanced targeting of ROIs
Enhanced targeting of ROIs
Interactive worksheets summarize study findings
Interactive worksheets summarize study findings
Interactive worksheets summarize study findings
Exceptionally data-rich patient reports
Exceptionally data-rich patient reports
Exceptionally data-rich patient reports
Overlays of previous biopsy targets provide valuable feedback
Overlays of previous biopsy targets provide valuable feedback
Overlays of previous biopsy targets provide valuable feedback
- Enriched, multi-parametric exam reviews
- Adjustable 3D segmentations for optimally guided biopsies
- Enhanced targeting of ROIs
- Interactive worksheets summarize study findings
- Enriched, multi-parametric exam reviews
-
Enriched, multi-parametric exam reviews
With a powerful, easy-to-navigate, multi-vendor MR image analysis system, DynaCAD can quickly process and manage large volumes of data. You can open cases in ready-to-read, custom hanging protocols with all images synchronized for easy, multi-parametric review. - Adjustable 3D segmentations for optimally guided biopsies
-
Adjustable 3D segmentations for optimally guided biopsies
You can reduce manual outlining of the prostate gland: DynaCAD Prostate’s model-based gland segmentation automatically performs a 3D segmentation of the gland. You can alter or adjust the segmented results in all three planes. The resulting segmentation reports overall gland volume and sets the stage for UroNav MR/US guided fusion biopsy procedures. - Enhanced targeting of ROIs
-
Enhanced targeting of ROIs
User generated ROIs can be displayed on a 3D model of the prostate as well as multiple image sequences from the study. - Interactive worksheets summarize study findings
-
Interactive worksheets summarize study findings
PI-RADS® v2.1 interactive worksheets collate and classify data related to exam findings. Users can mark the finding locations within regional diagrams and utilize the PI-RADS® v2.1 lexicon to record their characteristics and grade severity – with automatic projection of the ROIs into the PI-RADS® sector map(s). - Exceptionally data-rich patient reports
-
Exceptionally data-rich patient reports
You can set up patient reports to automatically capture pre-selected image sequences, kinetic curves, measurements, and annotations. Lesions are assessed according to PI-RADS® v.2.1 scoring and are automatically registered to the PI-RADS sector map as 2D projections. This data is incorporated into standardized reports. Upon completion, you can print patient reports, save as a PDF, or send as DICOM images. - Overlays of previous biopsy targets provide valuable feedback
-
Overlays of previous biopsy targets provide valuable feedback
DynaCAD’s reverse fusion feature maps and displays earlier fusion guided biopsy locations. Users can view previous targets and cores produced by UroNav, allowing them to track accuracy.
Enriched, multi-parametric exam reviews
Enriched, multi-parametric exam reviews
Enriched, multi-parametric exam reviews
Adjustable 3D segmentations for optimally guided biopsies
Adjustable 3D segmentations for optimally guided biopsies
Adjustable 3D segmentations for optimally guided biopsies
Enhanced targeting of ROIs
Enhanced targeting of ROIs
Enhanced targeting of ROIs
Interactive worksheets summarize study findings
Interactive worksheets summarize study findings
Interactive worksheets summarize study findings
Exceptionally data-rich patient reports
Exceptionally data-rich patient reports
Exceptionally data-rich patient reports
Overlays of previous biopsy targets provide valuable feedback
Overlays of previous biopsy targets provide valuable feedback
Overlays of previous biopsy targets provide valuable feedback
Related products
Alternative products
-
UroNav
- MR/US guided fusion biopsy system
- Transperineal or transrectal options
- Targeted biopsy
View product
-
DynaCAD Breast
- Post-processing image analysis
- Time efficient workflows
- Automated reports
View product
-
DynaCAD Urology
- View MR images and segmentation data
- Plan treatment steps and follow-up
- Gain time and workflow efficiencies
- Enhance confidence for biopsies
View product


-
UroNav
UroNav fuses pre-biopsy MR images of the prostate with ultrasound-guided biopsy images in real time, for excellent delineation of the prostate and suspicious lesions, as well as clear visualization of the biopsy needle path. Combining electromagnetic tracking and navigation with an onboard computer and a real-time imaging interface, UroNav brings precision targeting to your clinical practice in one easy-to-use, mobile workstation.
View product
-
DynaCAD Breast
Philips DynaCAD Breast is a multi-vendor breast MR image analysis system specifically designed to help you process and display large volumes of clinical images and data. With its sophisticated post-processing engine, DynaCAD Breast supports efficient, focused workflows by automating routine tasks and providing you with ready-to-read, custom hanging protocols. Its configurable worklists make for easy study management, and its comprehensive toolset provides added efficiency and confidence for your clinical assessments.
View product
-
DynaCAD Urology
DynaCAD Urology is a purpose build solution that empowers urologists with a dedicated set of tools for utilizing multi-parametric MR data in fusion biopsy workflows. It also provides a solution for managing patients’ biopsy data in urology.
View product
- DynaCAD Prostate is a module of the DynaCAD product.
- PI-RADS® is a registered trademark of The American College of Radiology.
- Product not available for sale in all countries. Please contact your sales representative to ascertain availability in your country.